Linear equations are some of the simplest equations and the easiest to plot. These types of equations appear abundantly in most subareas of mathematics and mostly in applied mathematics.
Graphing such an equation by plotting points comes down to finding points belonging to the graph using its equation.
It is pretty simple to find the points that will help you graph using equations and all that is needed to do is to find at least 2 points and draw a straight line using these two points.
Graph the equation by plotting points
let’s start with this simple example just to warm up
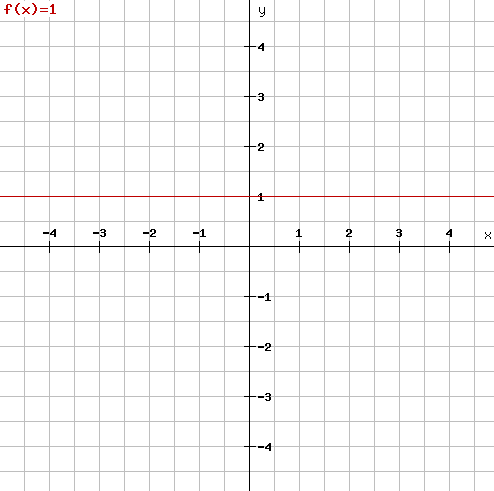
How do you plot the following equation?
![]()
Graphing the above equation will look like the following
let’s go the following example.
![]()
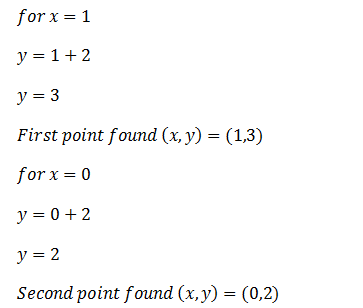
To find points on the line, we need to set one of the parameters to a certain value and find its counterpart.
We will set x to a certain value and find what is the corresponding y for each of the set values of x.
Plotting the graph, we will have the following
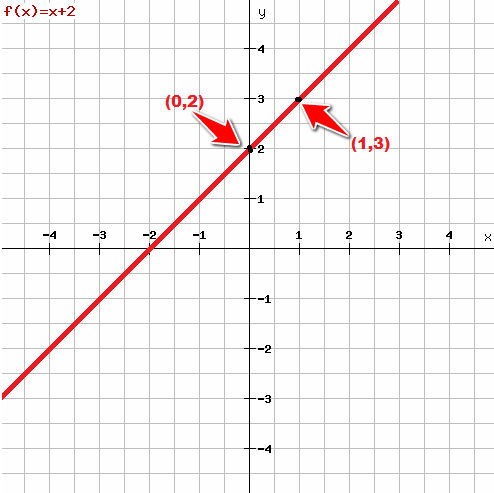
Note that to be sure of your result you can find the third point, and/or the first point using the same technique we used above, and the point you find should lie on the graph above.
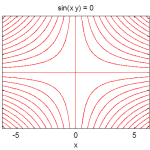
You can as well choose to check your result using some online applications like http://rechneronline.de/function-graphs/ or using Matlab.
Related posts:
 Write a Function That Find the Volume of a 3D Rectangle in Matlab
 EZPLOT vs PLOT in Matlab
 Matlab Matrix Operations – Exercise
 For Loop in Matlab
 Scalar Functions in Matlab: E Matlab, Cosine Function and More
 Vectors in Matlab: Basic Operations
 Left Division vs Right Matrix Division – Matlab
3 Best Free Matlab Alternatives
Left Division vs Right Matrix Division – Matlab
3 Best Free Matlab Alternatives