Here is a quick comparison of the EZPLOT and PLOT in Matlab. We have recently separately worked with both commands in the previous posts which you can have a look at.
EZPLOT and PLOT are two commands that allow to graph function in Matlab.
Here is how to use them.
Ezplot vs plot in Matlab
Plotting with EZPLOT
EZPLOT is an easy to use function plotter. Compared to PLOT, it is a hassle-free-plotter. All you need to do to use it is to state the function you would like to plot, and it does the rest of the job.
Let’s use the examples below to see how to plot using with EZPLOT in Matlab.
Example 1
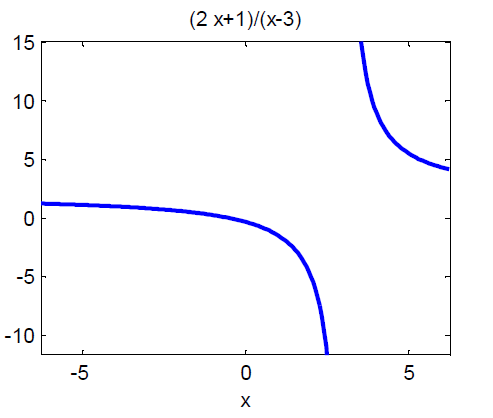
Here is a function which we want to graph.
The code
[php]y=ezplot(‘(2*x+1)/(x-3)’)
set(y,’Color’,’b’,’LineWidth’,2) % Make the line blue and the linewidth 2[/php]
The Graph
Example 2
The code
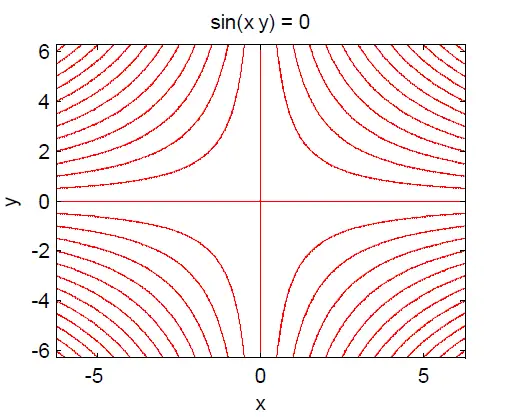
[php]f=ezplot(‘sin(x*y)’)
set(f,’Color’,’r’) % Make the line red[/php]
The graph
Plotting with PLOT
Example 1
The code
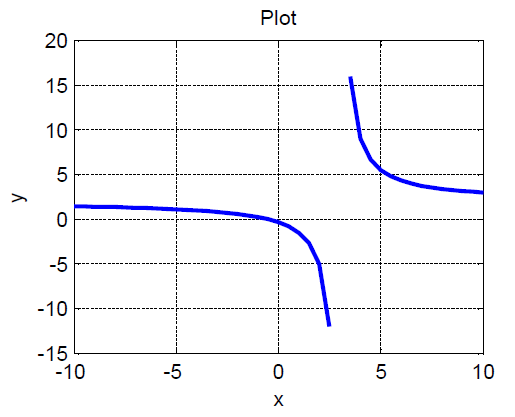
[php]x=-10:0.5:10; % x varies from -10 to 10 with an incremental step of 0.5
y=(2.*x+1)./(x-3);
plot(x,y,’linewidth’,2)
grid on
ylabel(‘y’)
xlabel(‘x’)
title(‘Plot’)[/php]
The graph
You must have noticed how complex it is to graph with PLOT. You need to indicate the range of variation of the main variable, and you need to express the first variable with respect to the second.
Example 2
Graphing this will be hard using PLOT, since it requires that you write y on one side of the equation and x on the other side. But solving this equation will require you use some guess on the other side to replace zero to help you be able to split xy, and even then you will be plotting only one hypothesis. EZPLOT is the best of the two options for cases like this one.


