By now, you should have learned the basics of plotting in Matlab using previous post. In this session we want to look closer to how we can plot a conditional plot using Matlab Here is an easy example of a conditional plot 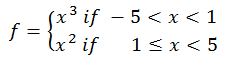
plot f
Conditional plotting in Matlab
One of the way you can walk to easily plot f is the following Matlab code
x=-5:0.1:5;
for n=1:length(x)
if x(n)<1
f(n)=x(n)^3;
else
f(n)=x(n)^2;
end
end
plot(x,f,'--r','linewidth',2)
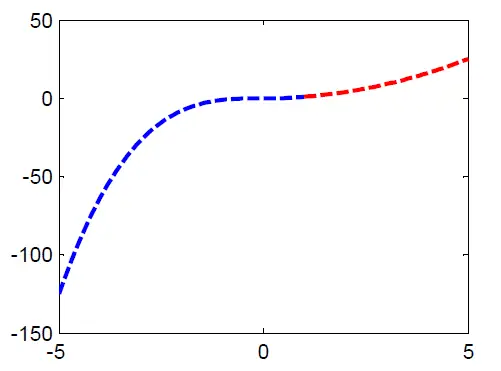
which returns

If you were just to plot half of the graph each time and add up plots, the code would look like
% Part 1
x=-5:0.1:1;
f=x.^3;
plot(x,f,'--b','linewidth',2);
% Part 2
x=1:0.1:5;
f=x.^2;
hold on;
plot(x,f,'--r','linewidth',2)
Content you might like:
- Plotting in Matlab – The Basics
- Graph the equation by plotting points
- Plotting equations using EZPLOT – Matlab
- EZPLOT vs PLOT in Matlab
- Conditional plotting in Matlab
- Matlab plot colors and Styles
Related posts:
 Write a Function That Find the Volume of a 3D Rectangle in Matlab
 EZPLOT vs PLOT in Matlab
 Matlab Matrix Operations – Exercise
 For Loop in Matlab
 Matlab Polynomial: Division and Multiplication
 Scalar Functions in Matlab: E Matlab, Cosine Function and More
 Vectors in Matlab: Basic Operations
 3 Best Free Matlab Alternatives