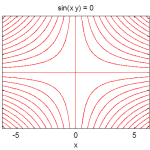
We have recently used the EZPLOT technique to plot in Matlab, which is indeed an easier technique to plot compared to the one we are going to make use of in this post.
Plotting functions gives us a visual description of the behavior of the latter as we change the system variable. And Matlab is THE TOOLS that will help you plot with the less hassle possible while giving you a wide range of handiness of what you will be capable of.
Plotting in Matlab
plot(A,B) plots vector B versus vector A and plot(Y) plots the columns of Y versus their index.
Plotting example 1
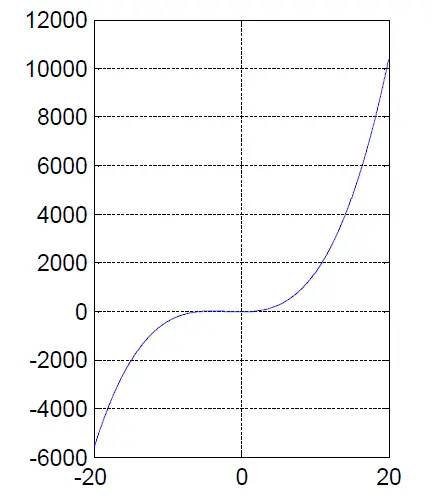
Let’s plot one of the polynomial equations we have recently solved here.
Plotting this function in Matlab will look like the following
We first have to select the range of the variable and the incremental value of the variable vector
Here is the code
x=-20:0.05:20;
y=x.^3+6*x.^2-20;
plot(x,y);
grid on;
The first line simply means that we want the variable x to start at -20 and to end at 20, and it has to increase with a step of 0.05 from its initial value to its final value. If you type the following code in Matlab (without the; at the end)
x=-20:0.05:20
Matlab will give you all the values of the element of the vector x.
The Second line tells Matlab to compute y for each value of x.
Grid on asks Matlab to display the grid while plotting y versus x.
Here is the plot
Plotting example 2
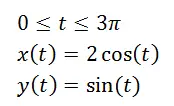
In this example, let’s plot 2 graphs in one plot. The following are the functions:
Here is the code
t=0:pi/50:3*pi;
xt=2*cos(t);
yt=sin(t);
plot(t,xt,'r',t,yt,'b');
grid on;
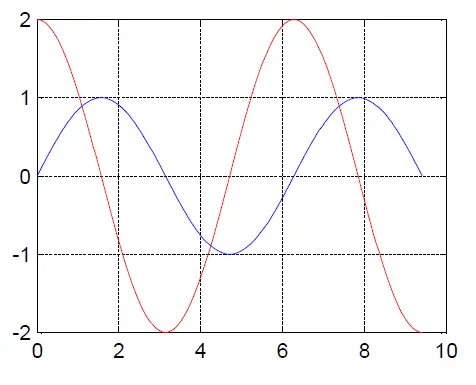
And the plot is the following.
The following line
plot(t,xt,'r',t,yt,'b');
Means that I want x(t) plot to be Red and y(t) plot to be Blue.
Use the line
Help PLot
or
Doc plot
To read more about PLOT in Matlab
Plotting example 3
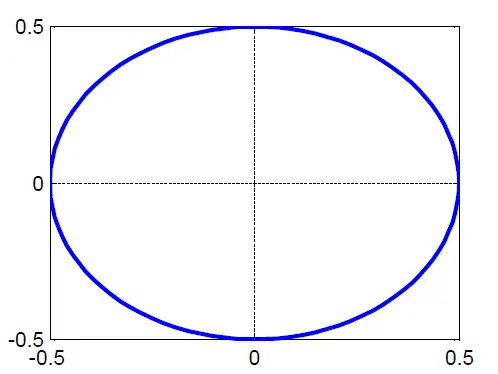
Let’s plot a circle of 0.5 of radius
code:
Alpha=linspace(0,2*pi);
plot(0.5*cos(Alpha), 0.5*sin(Alpha),'LineWidth',2)
The plot:
‘LineWidth’,2 simply set the thickness of the plot to 2.
linspace(A, B) generates a row vector of 100 linearly equally spaced points between A and B
Here are just the basics in plotting with Matlab, but with what you have just learned you can start plotting and always remember that you can use Matlab Help to learn more while using Matlab.

